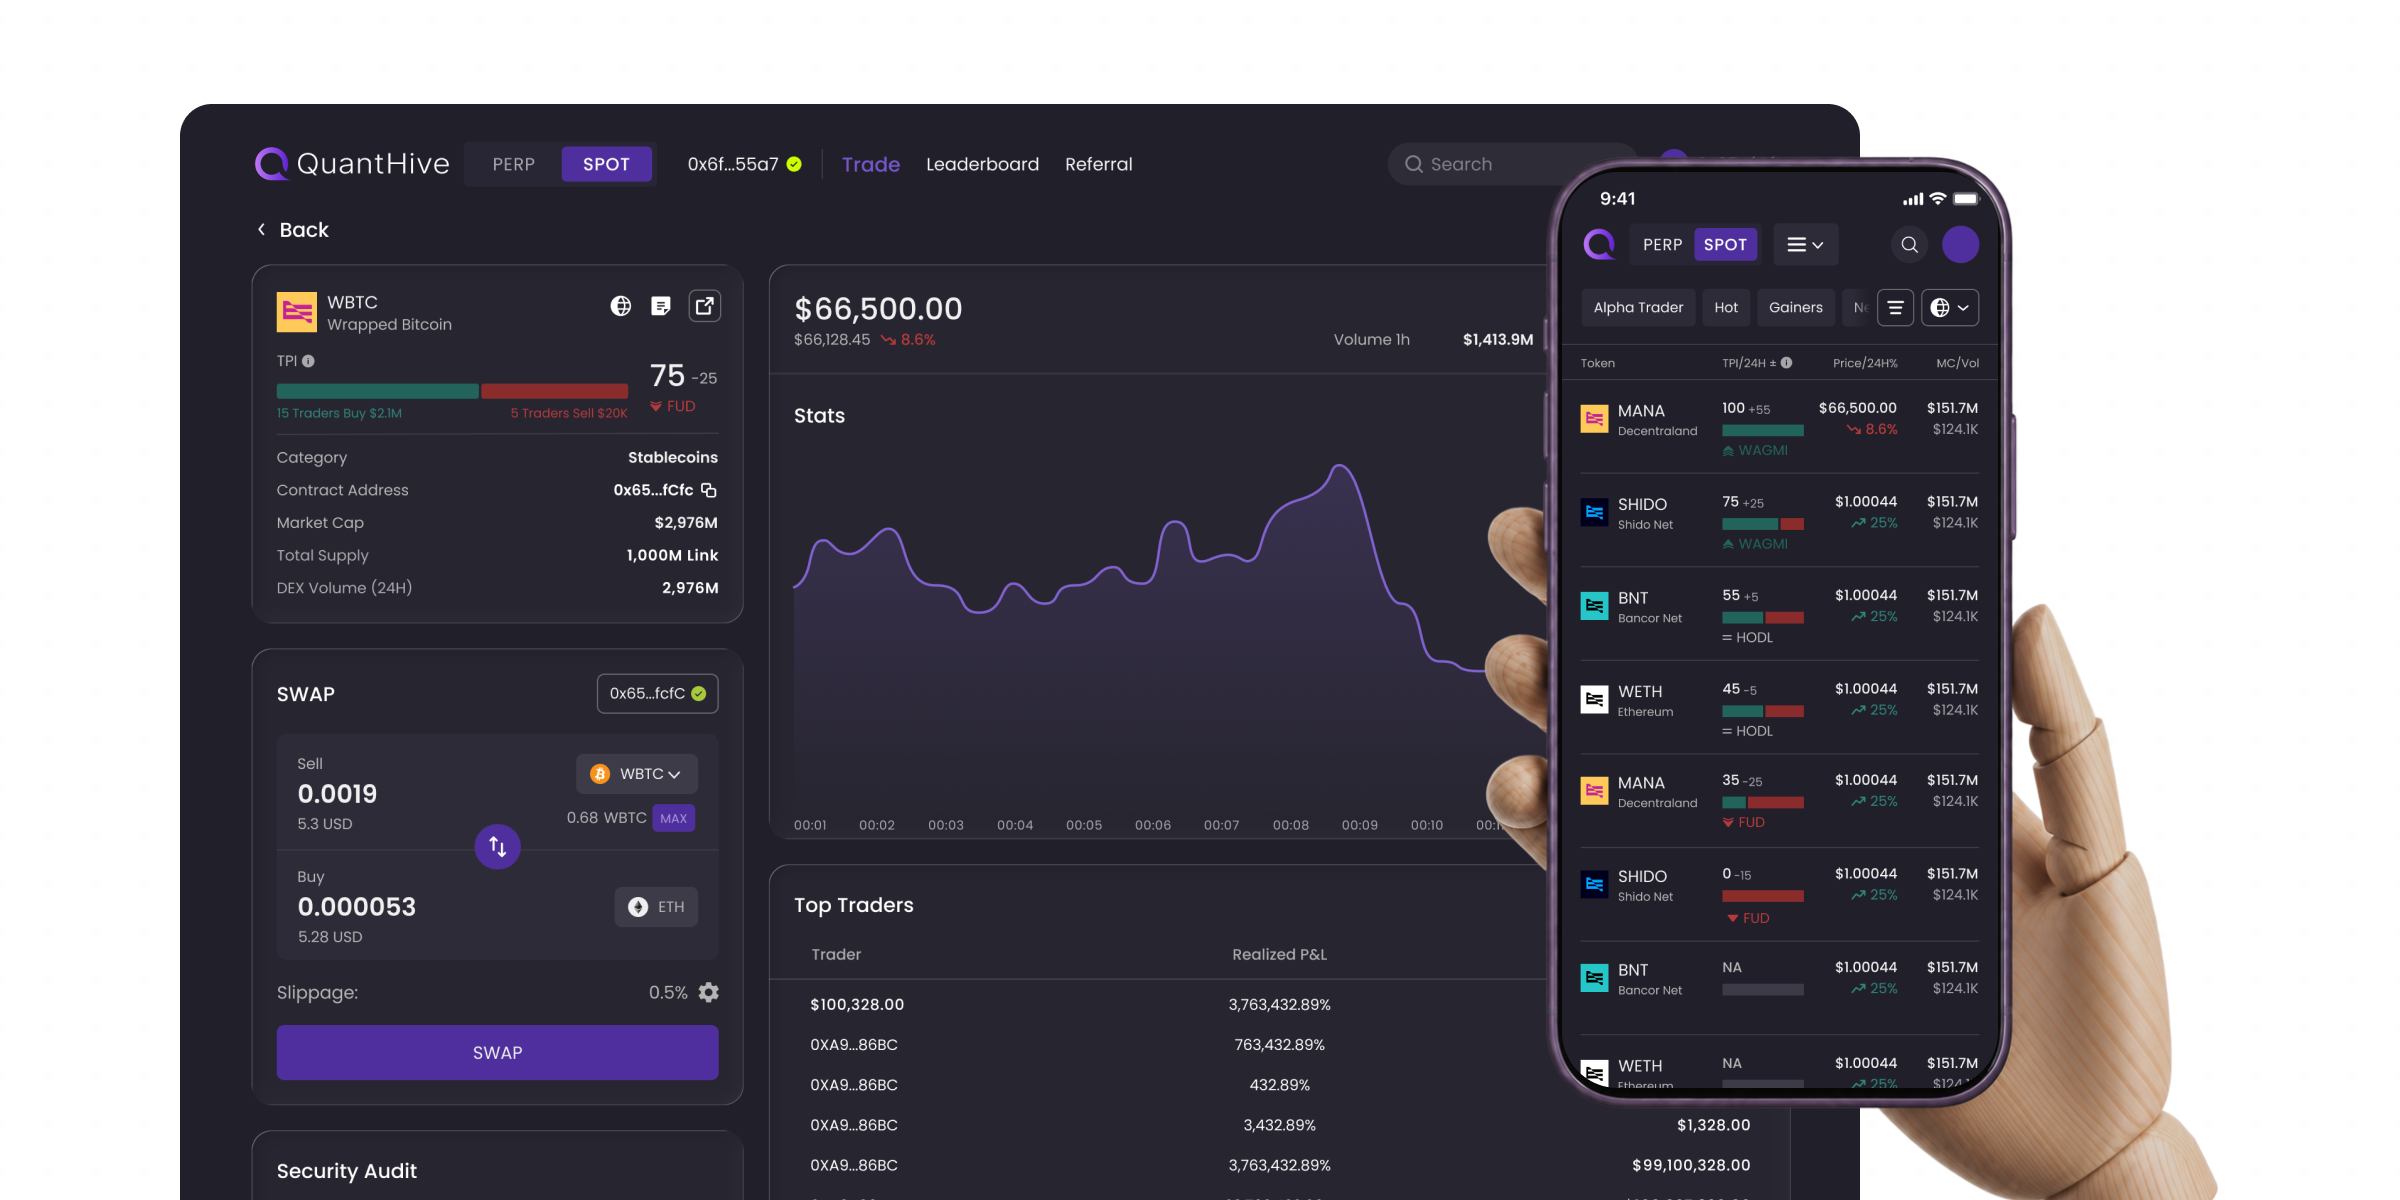
Designed a connected journey around TPI, referrals, and the leaderboard—turning individual actions into a loop that encouraged users to swap, invite others, and return, ultimately driving higher completion and repeat engagement.
My Role: Solo Designer
Duration: 24'Dec - 25'May (6 months)
Cooperated with 1 PM, 2 Devs (Frontend & Backend), MKT/OP team
When I joined, the product already had core features including login, wallet connection, a dashboard, and token swapping. The mission I got was to differentiate the product in the market and drive user growth.
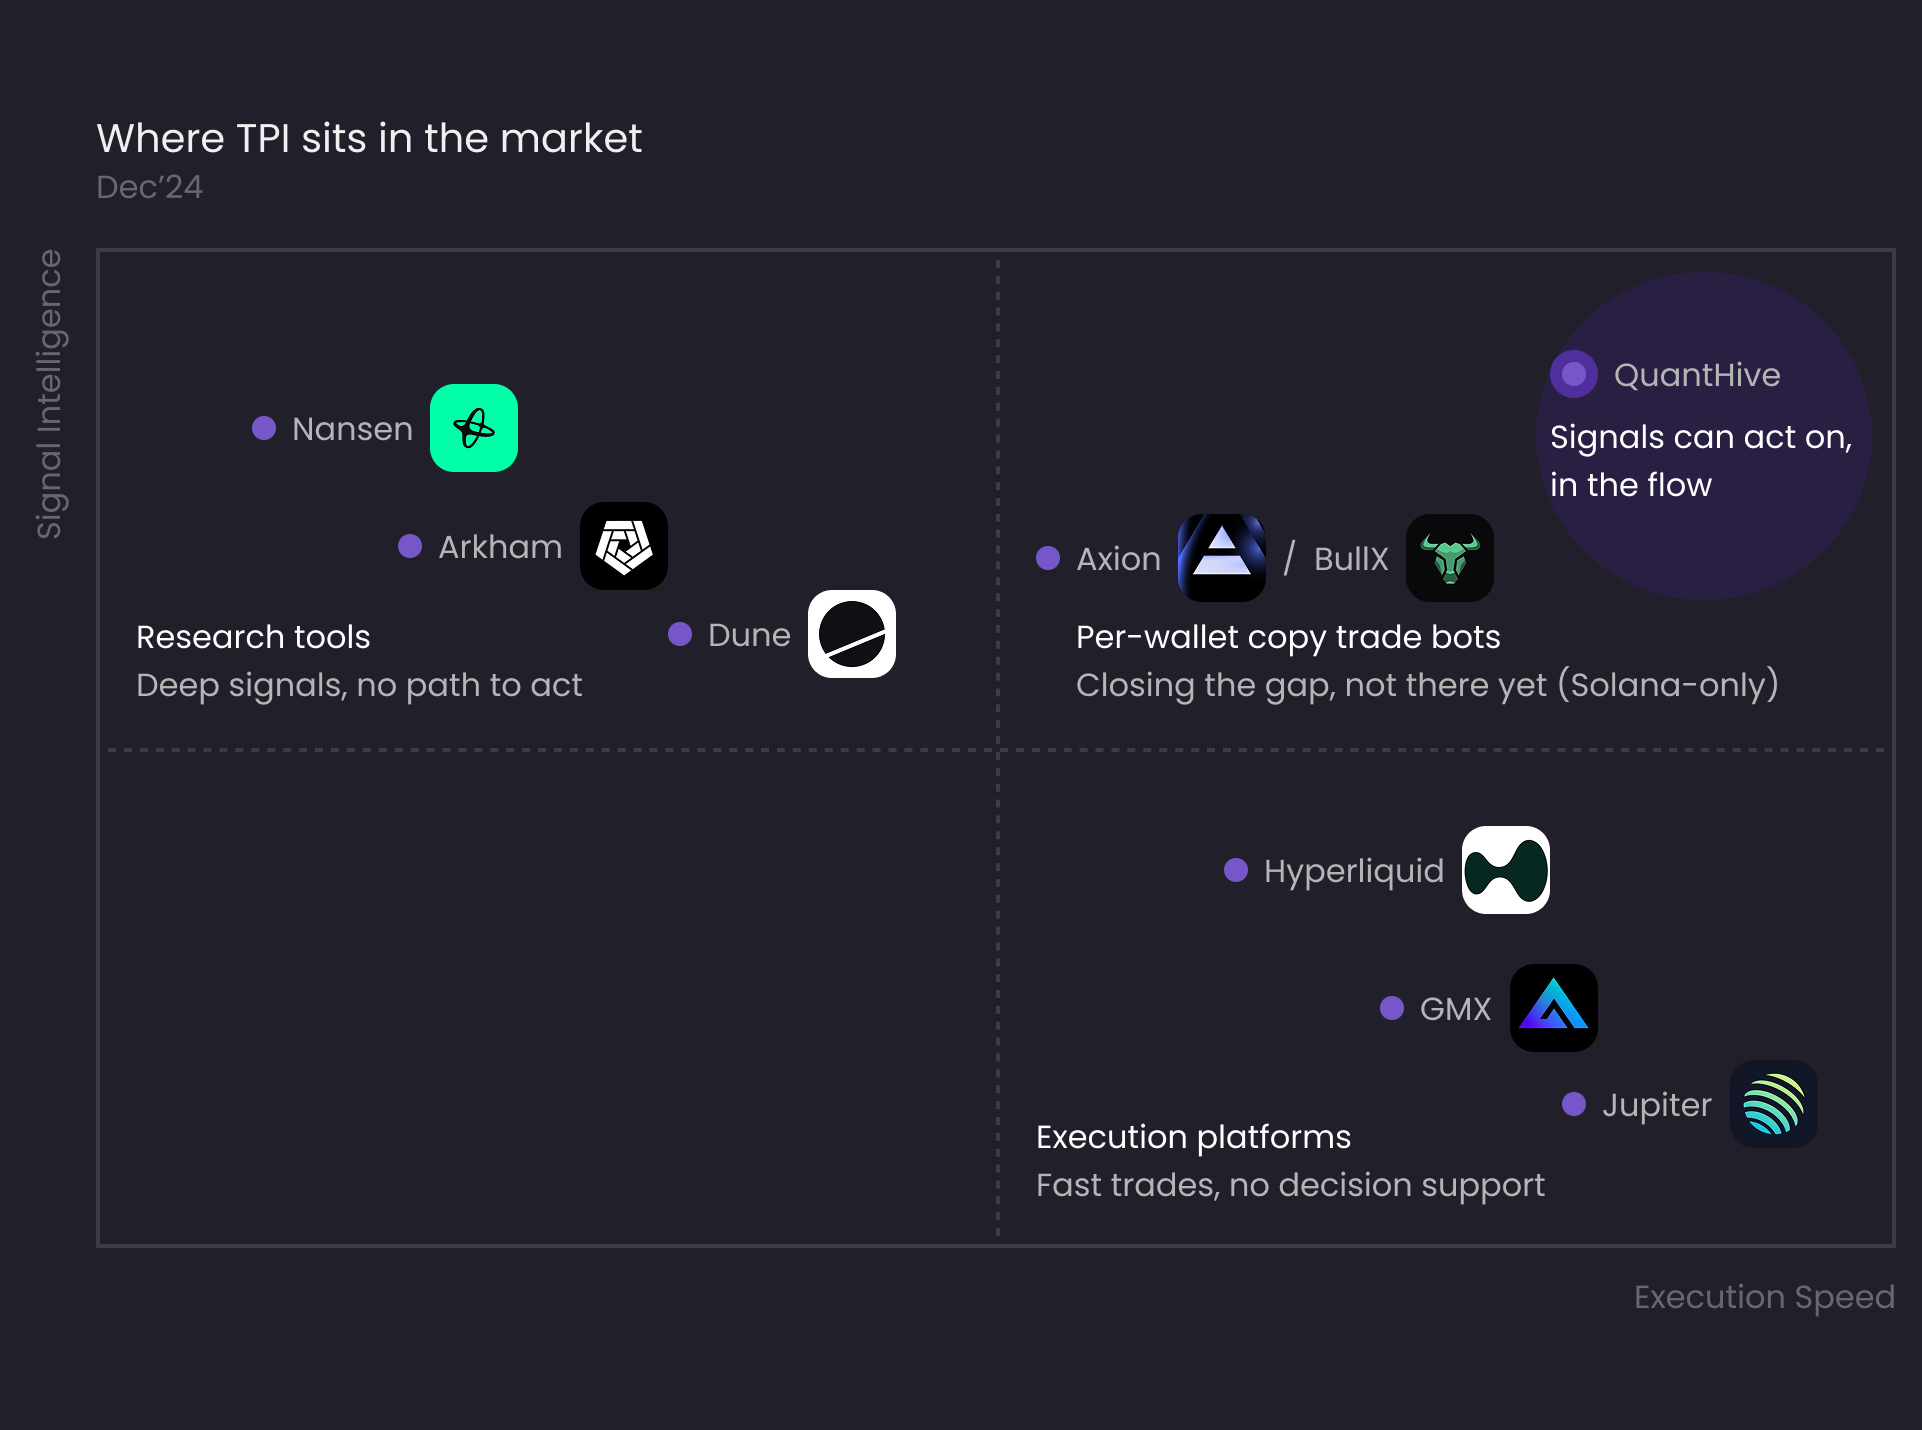
On-chain analytics platforms like Nansen and Arkham help traders discover smart-money signals, but users often need to leave the platform to act on them. Execution platforms like Hyperliquid and GMX optimize for speed and precision, assuming users already know what to trade.
QuantHive saw an opportunity between the two: bringing actionable trader-flow signals directly into the trading flow, connecting decision-making with execution.
TPI is a 0–100 score that shows whether top 2% traders are currently leaning toward Accumulation or Distribution. It compares buying vs. selling activity for quick interpretation.
・56-100: Strong accumulation (high buy volume)
・45–55: Mixed or neutral sentiment
・0-44: Distribution (higher sell volume)
Momentum measures the percentage change in TPI over the past 24 hours, showing whether trader positioning is strengthening or weakening.
・When short-term volume exceeds long-term volume, Momentum is rising, indicating growing trader interest and hype.
・When short-term volume falls below long-term volume, Momentum is declining, signaling waning enthusiasm or potential profit-taking.
For users who aren’t data-driven analysts, Flow Signals turn real trading patterns from consistent top performers in Web3 into clear, actionable insights.
・WAGMI: High buy-side volume and rising interest from alpha traders
・FUD : High sell-side activity or declining interest
・HODL: No strong buy/sell signals or stable interest
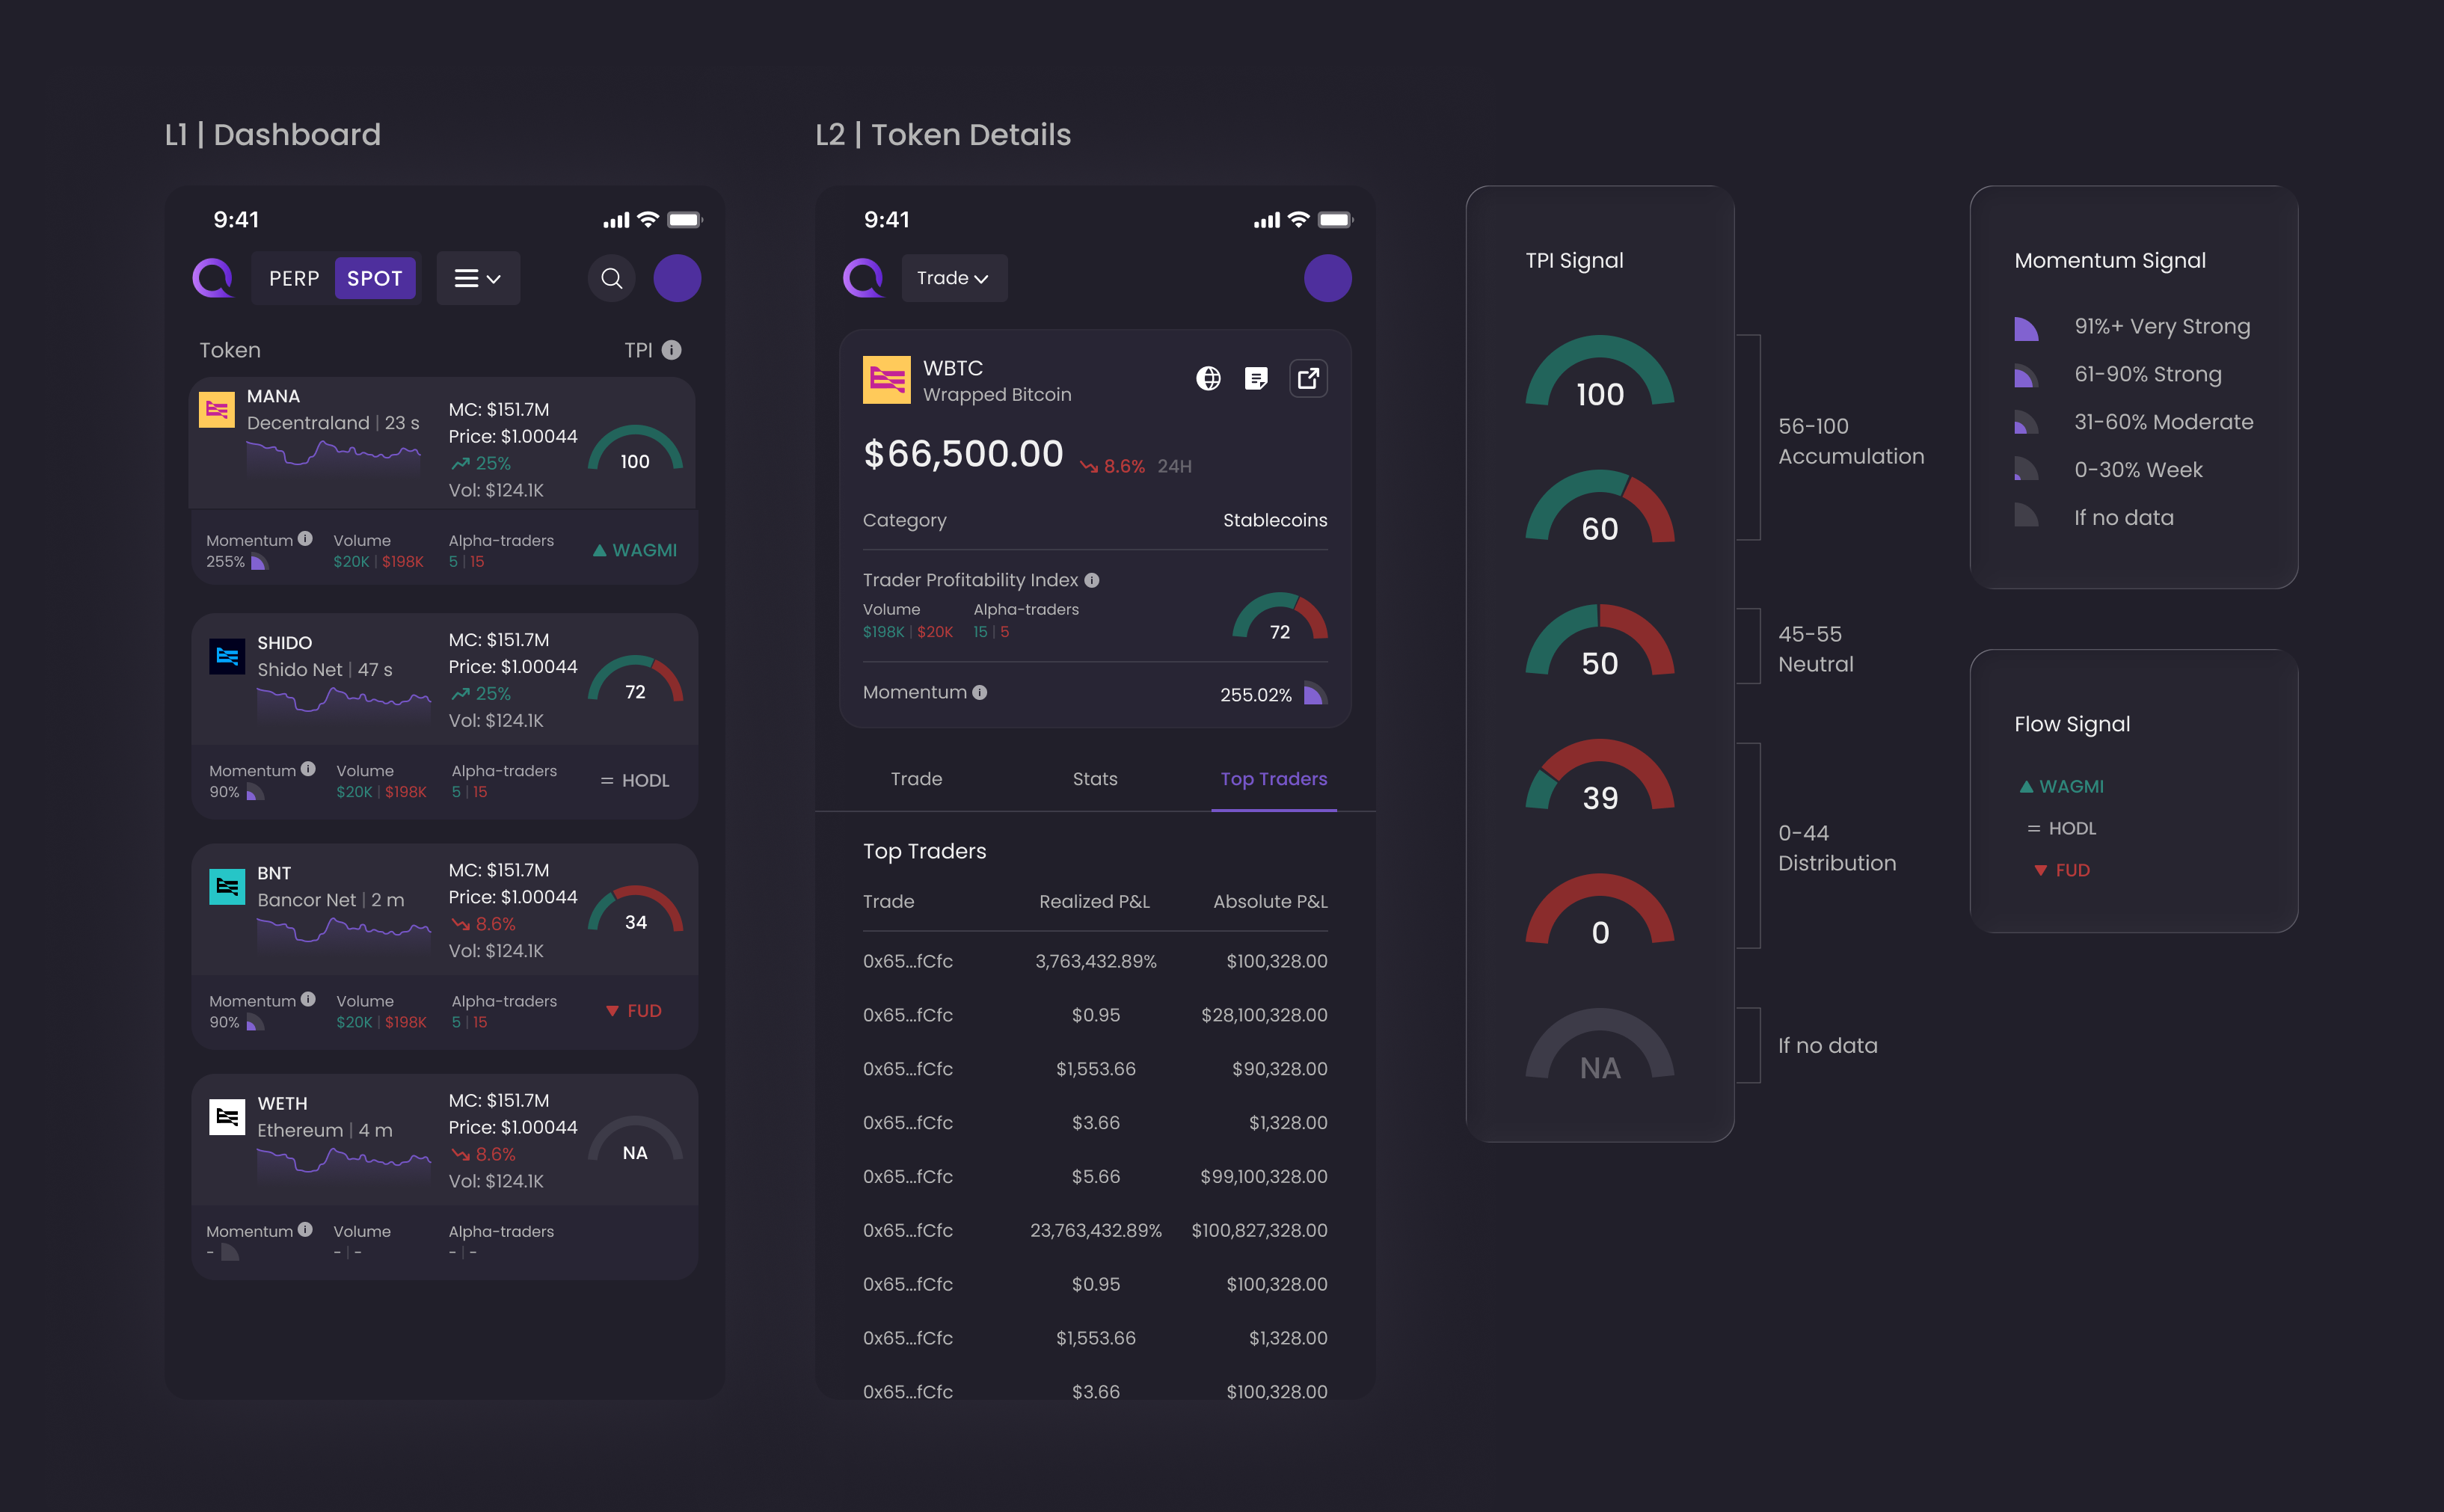
Discussions with power users revealed a key challenge: the information felt fragmented. The issue wasn't a lack of data, but how it was prioritized and presented. While the dashboard contained many standard data points, TPI was still a relatively new concept. Adding more information risked overwhelming users who simply wanted to understand the signal and make a decision. This led me to rethink the information hierarchy: rather than presenting everything at the same level, we focused on guiding users through the core TPI insight first, while progressively revealing deeper data when needed.
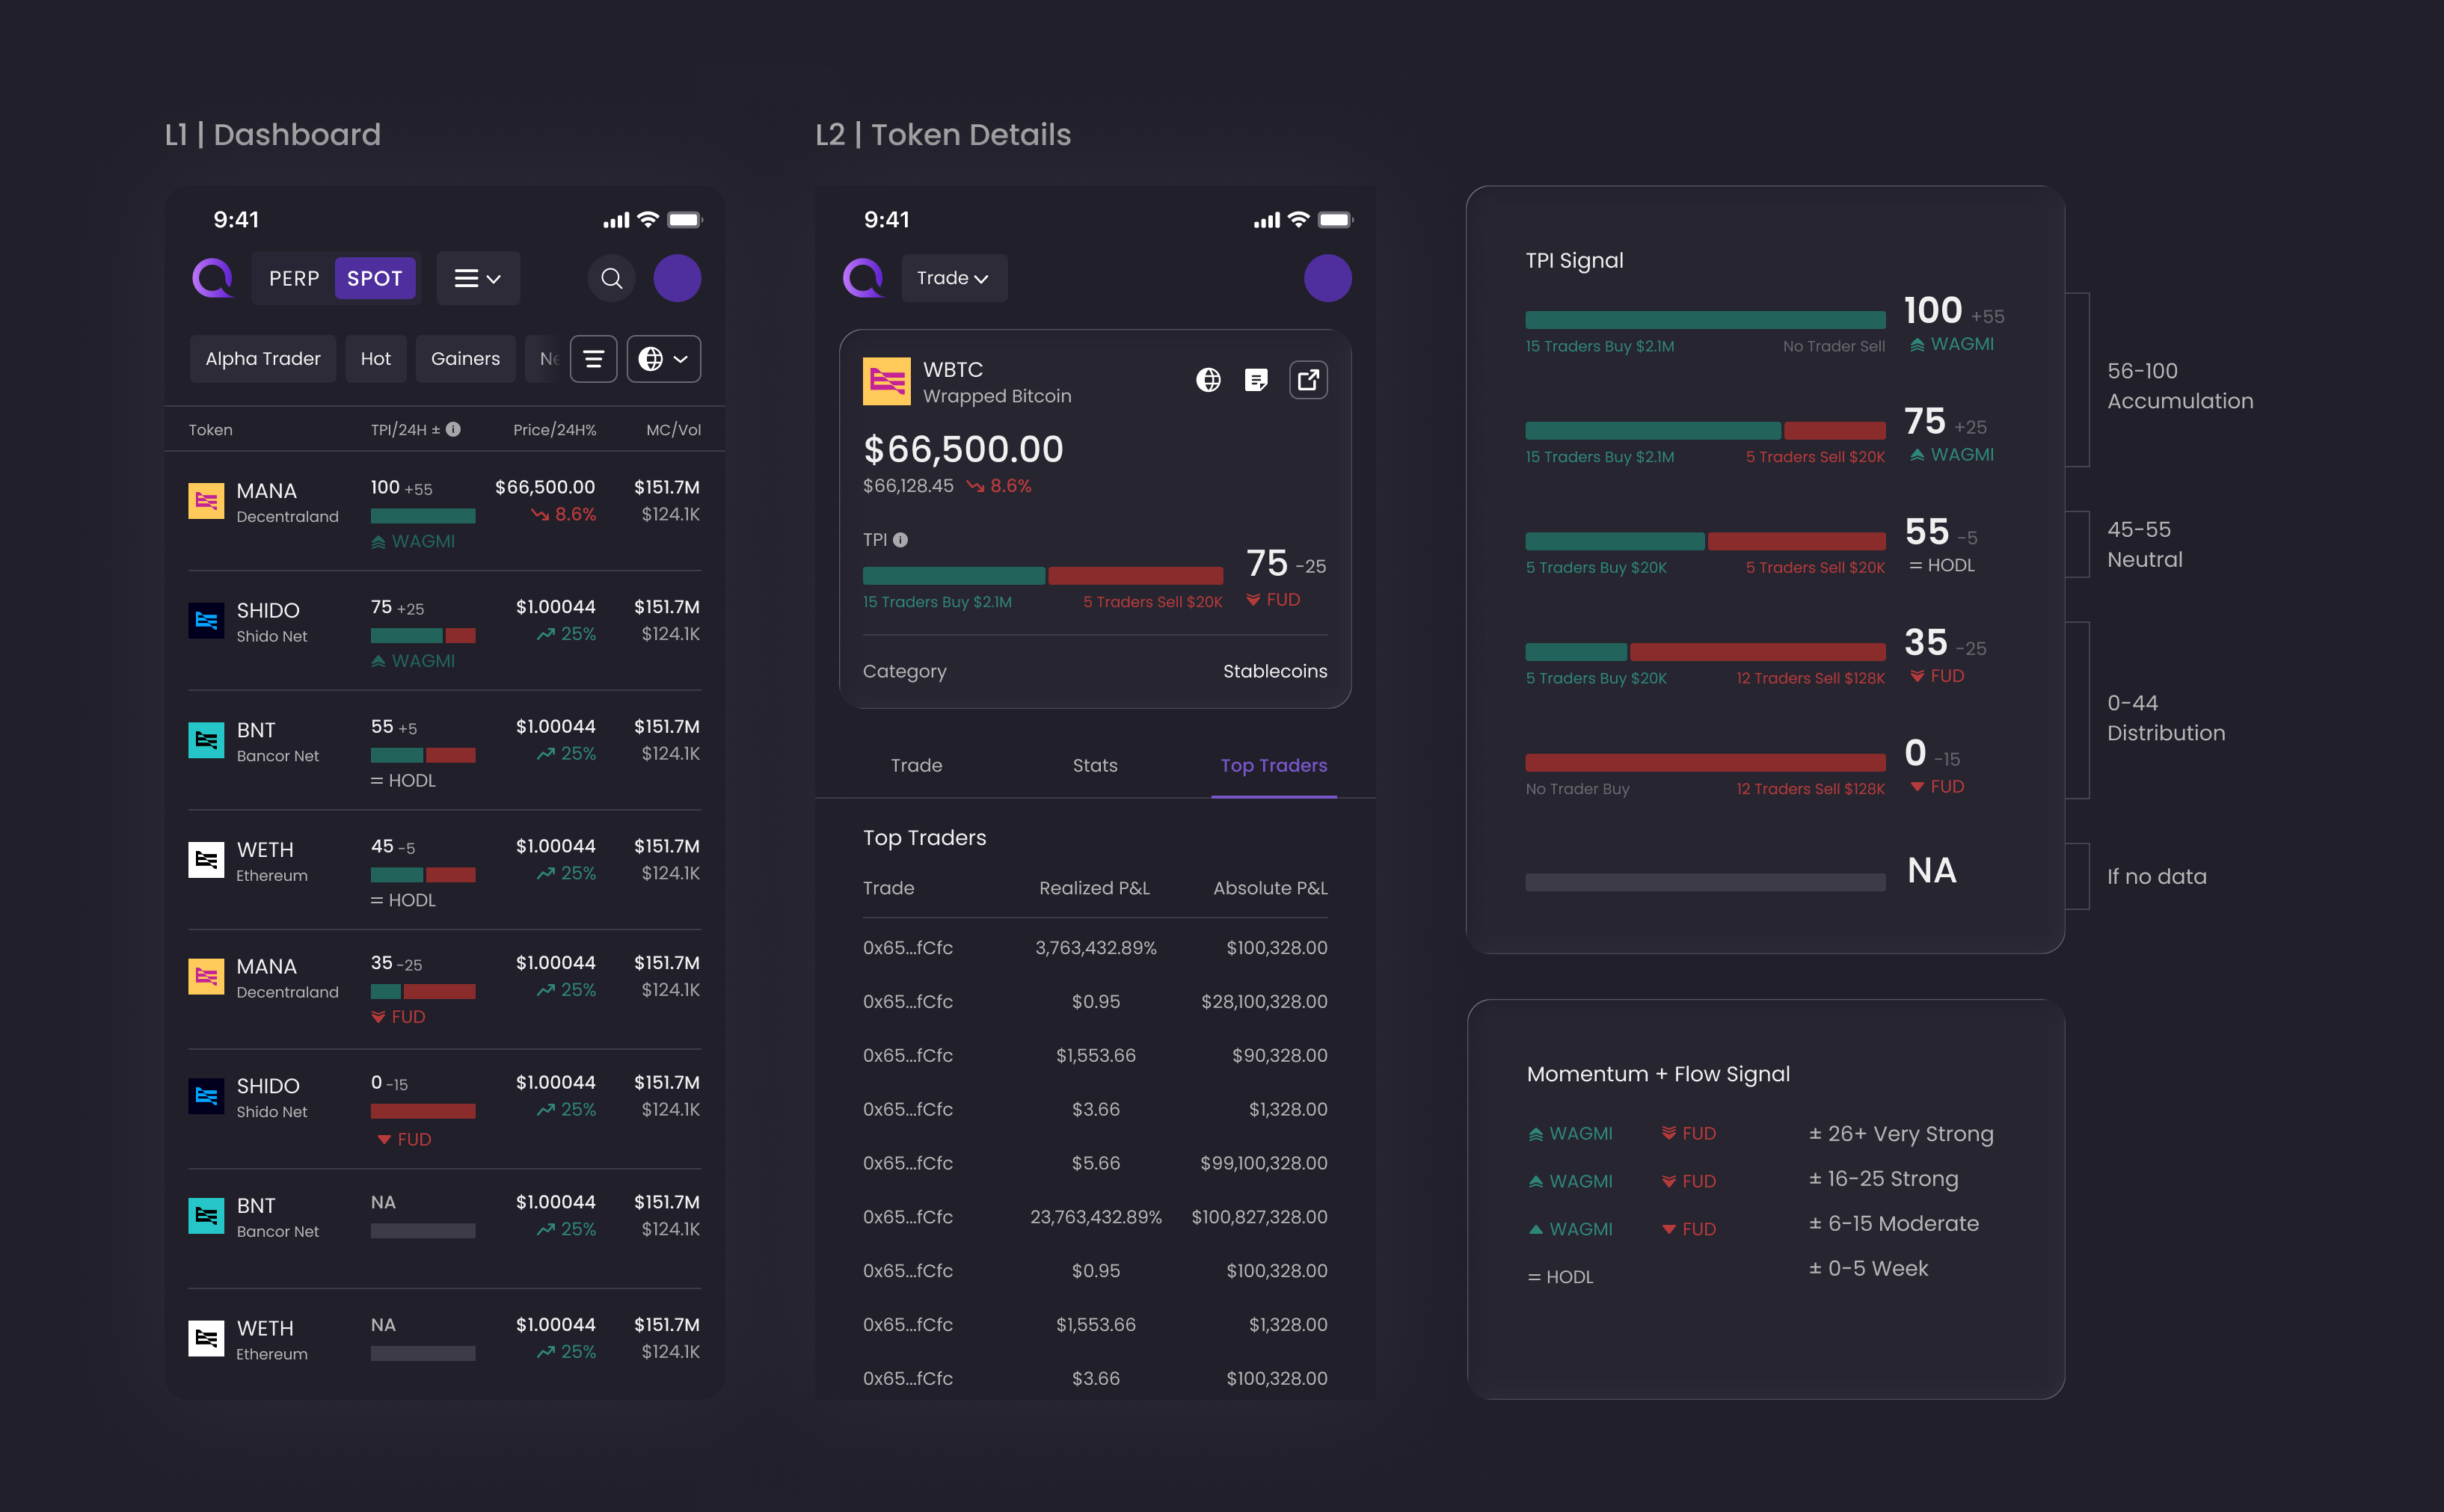
We consolidated TPI-related information into a dedicated section. Rather than adding more to the existing layout, I removed lower-priority content and restructured the hierarchy around the most important insights.
Raw Buy/Sell data provides valuable context for analytical users, but didn't need to live on the dashboard. I saved it on the Token Detail page, keeping the primary view focused while preserving access to deeper data.
Percentages required users to mentally connect values with Buy/Sell direction and made comparisons hard. We combined Momentum and Flow signals and converted the underlying data into a clearer, explicit value through backend calculations.
I replaced the existing visualization with a linear gauge to create a cleaner, more consistent layout and make the signal easier to scan and compare.
As TPI gained traction, community engagement continued to grow, creating an opportunity to accelerate user growth. But growth isn't just about acquiring more users. We wanted to understand what behaviors indicate meaningful product activation, and how we could use rewards to encourage them.
Referral is typically designed around two-sided incentives. In our case, referrers earn 20% of the trading fees generated by referred users on each swap, while referred users receive a 1.3x point boost. Users can either share their own referral link or bind someone else's link to their account.
The Leaderboard turns points into visible progress, showing users their rank within the trading community. A progressive tier tracker gives users a clear path to unlock higher-status benefits, such as Alpha-Trader community access, early beta features, and exclusive communities. Also, to make points feel tangible, we connected them to real rewards such as NFTs, token airdrops, and fee discounts.
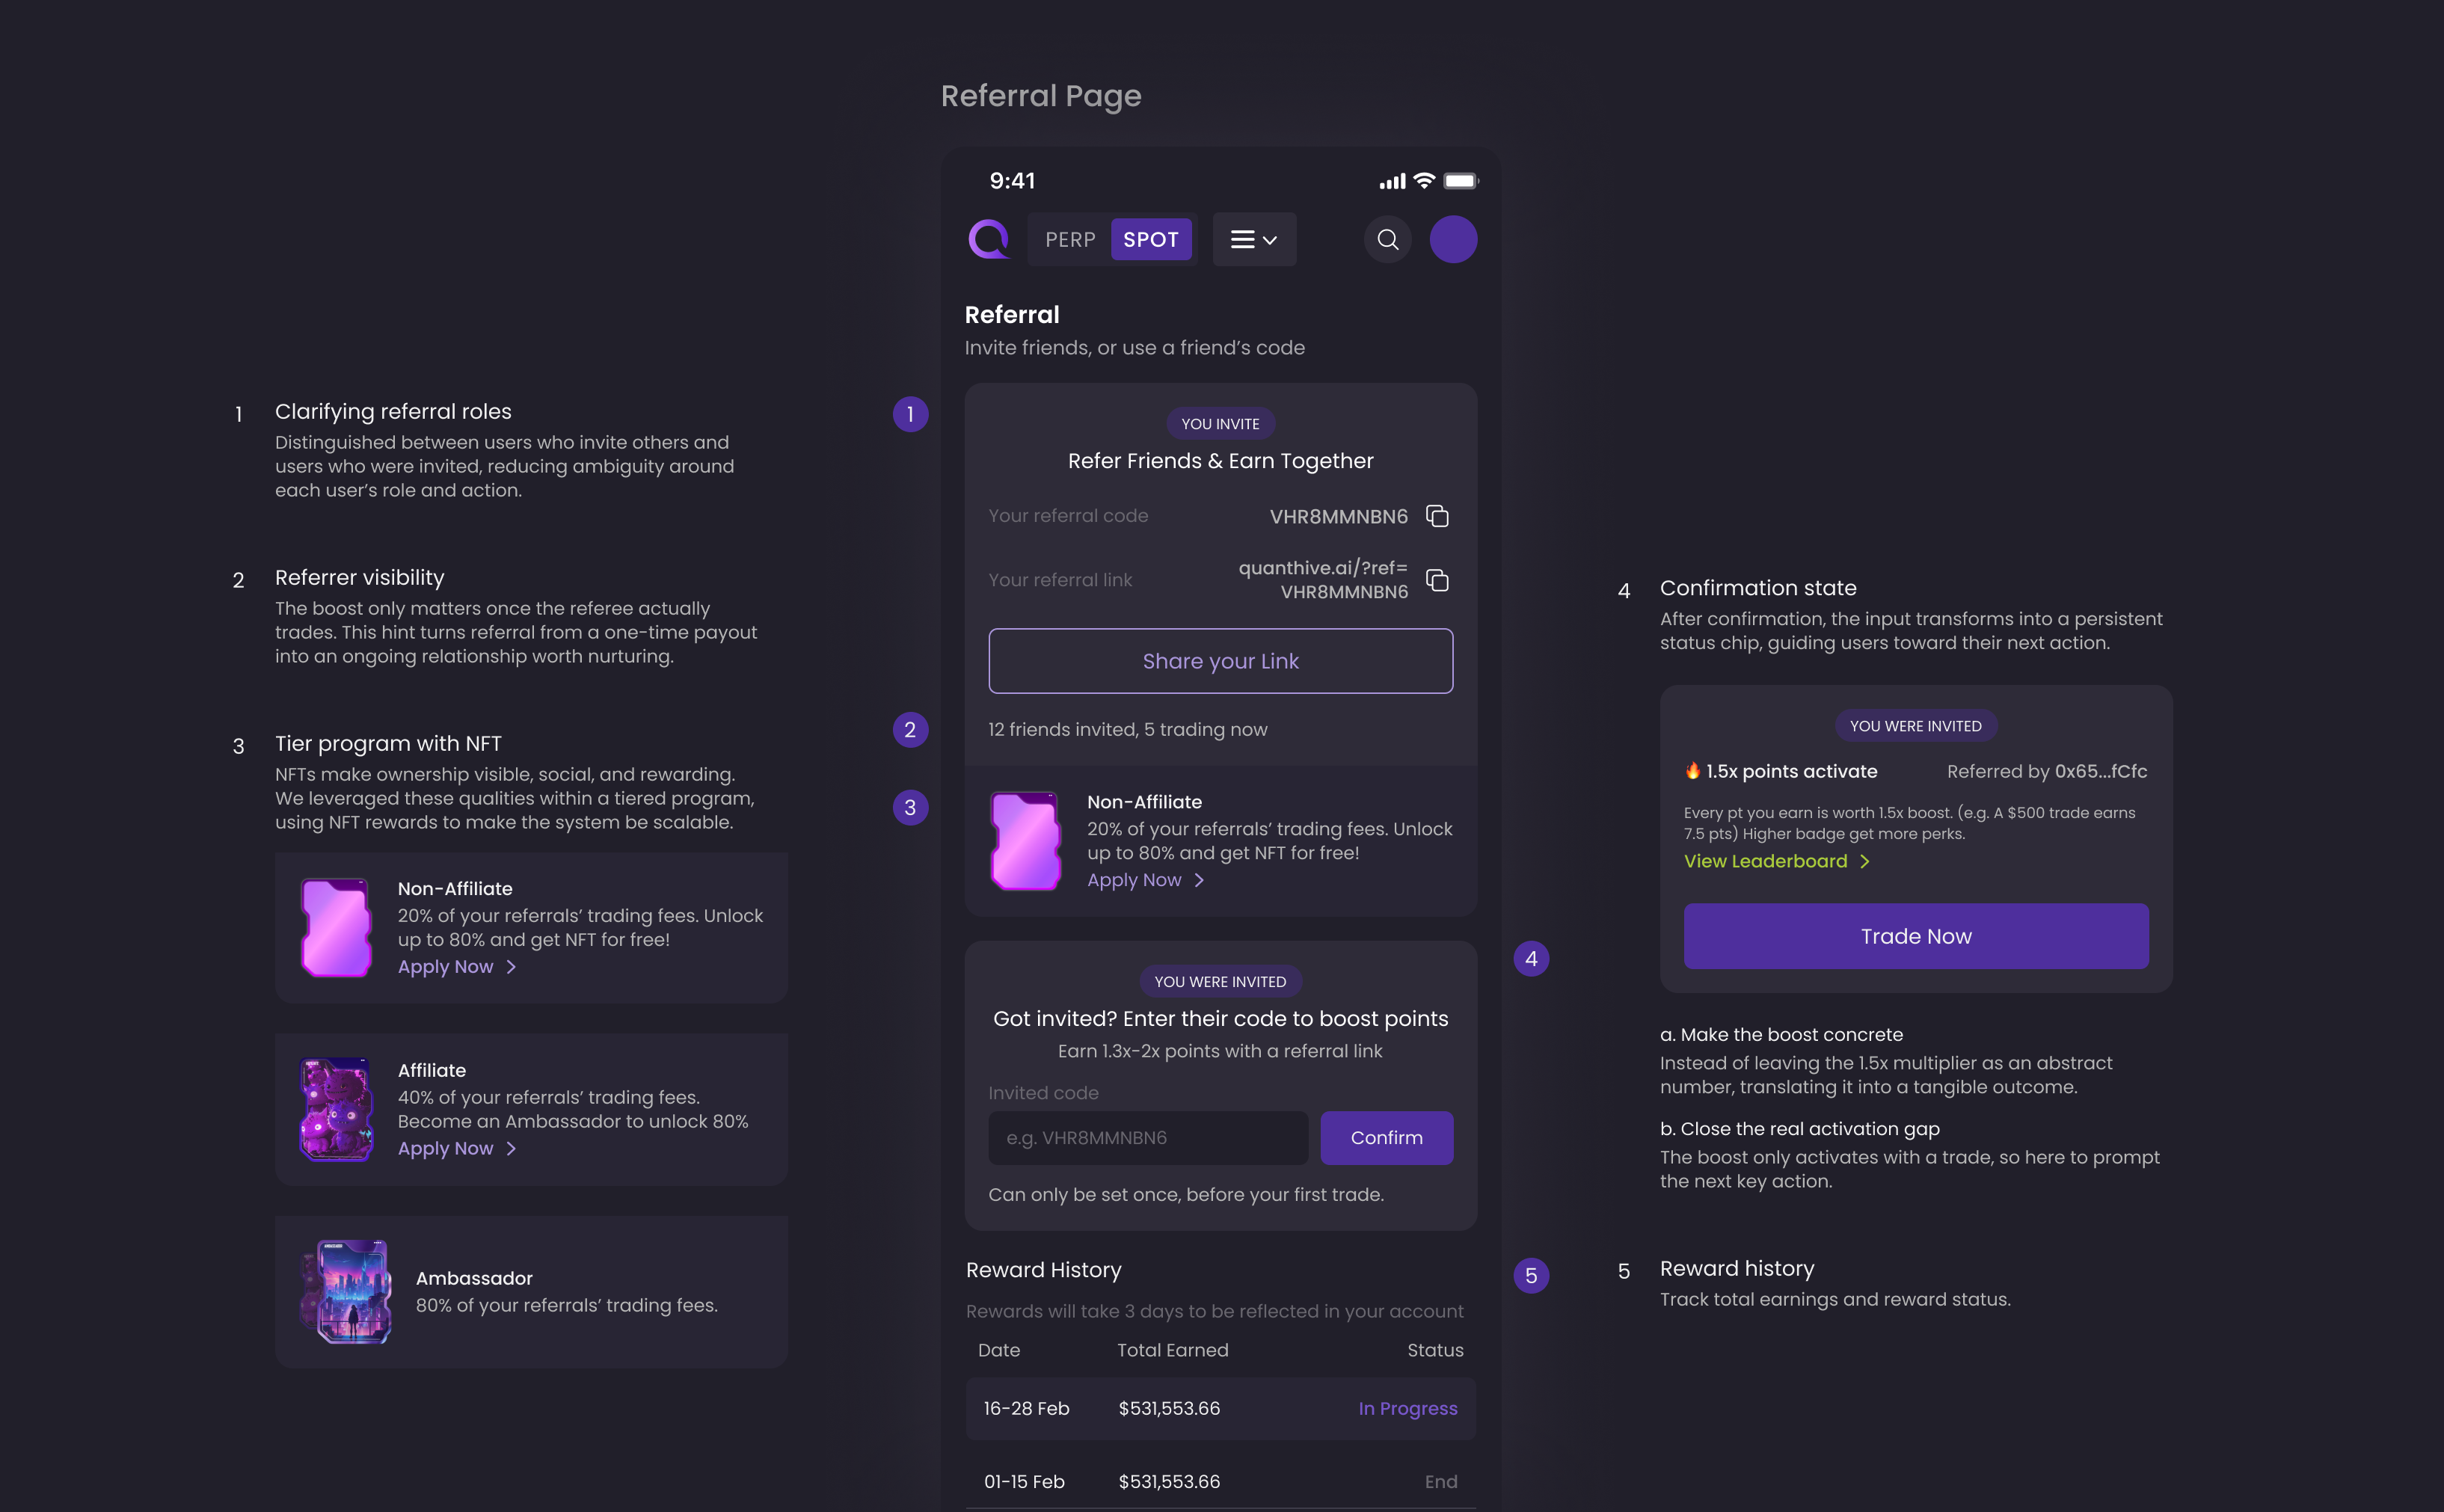
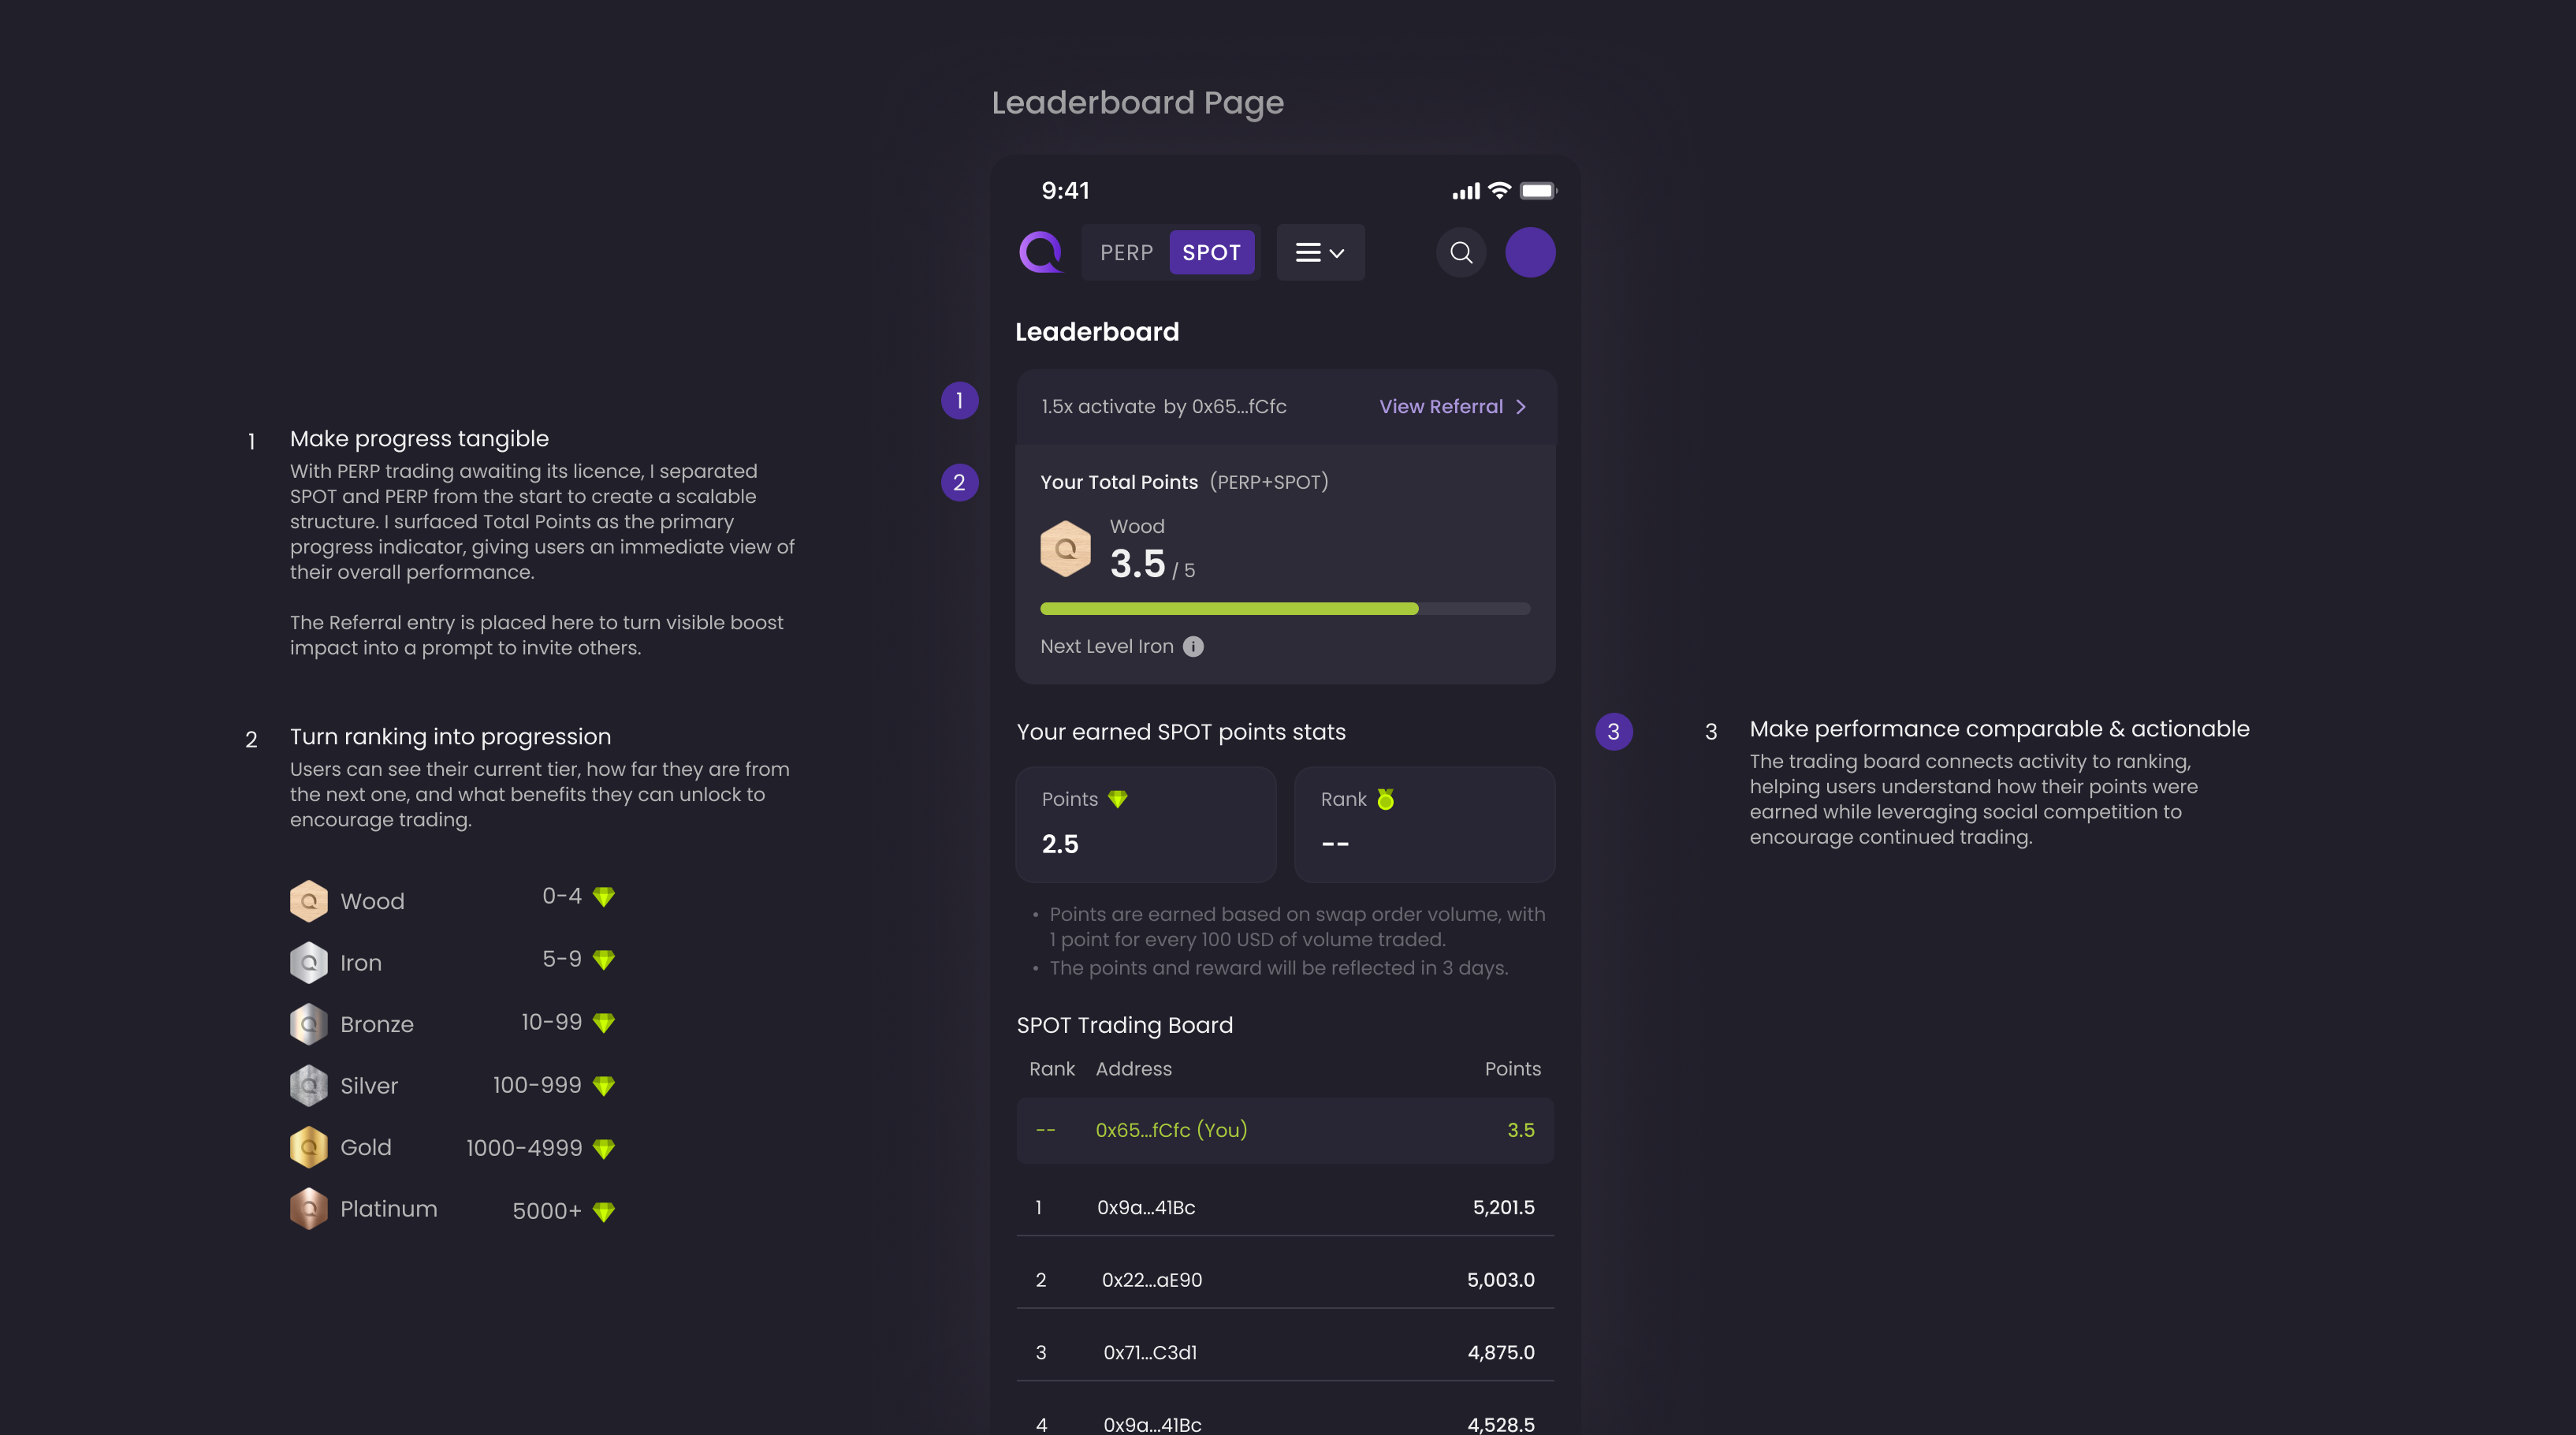
“Growth” can mean more than simply acquiring users. Referral helped bring new users into QuantHive, but a successful referral alone didn't mean they had activated or found value in the product. Meanwhile, the Leaderboard created a sense of progression through points, rankings, and badges.
I saw an opportunity to connect these two experiences: use Referral as the acquisition entry point and Leaderboard as a mechanism for continued progression, with each touchpoint guiding users toward their first trade. The goal was to make each step reinforce the next, turning acquisition into deeper product adoption.
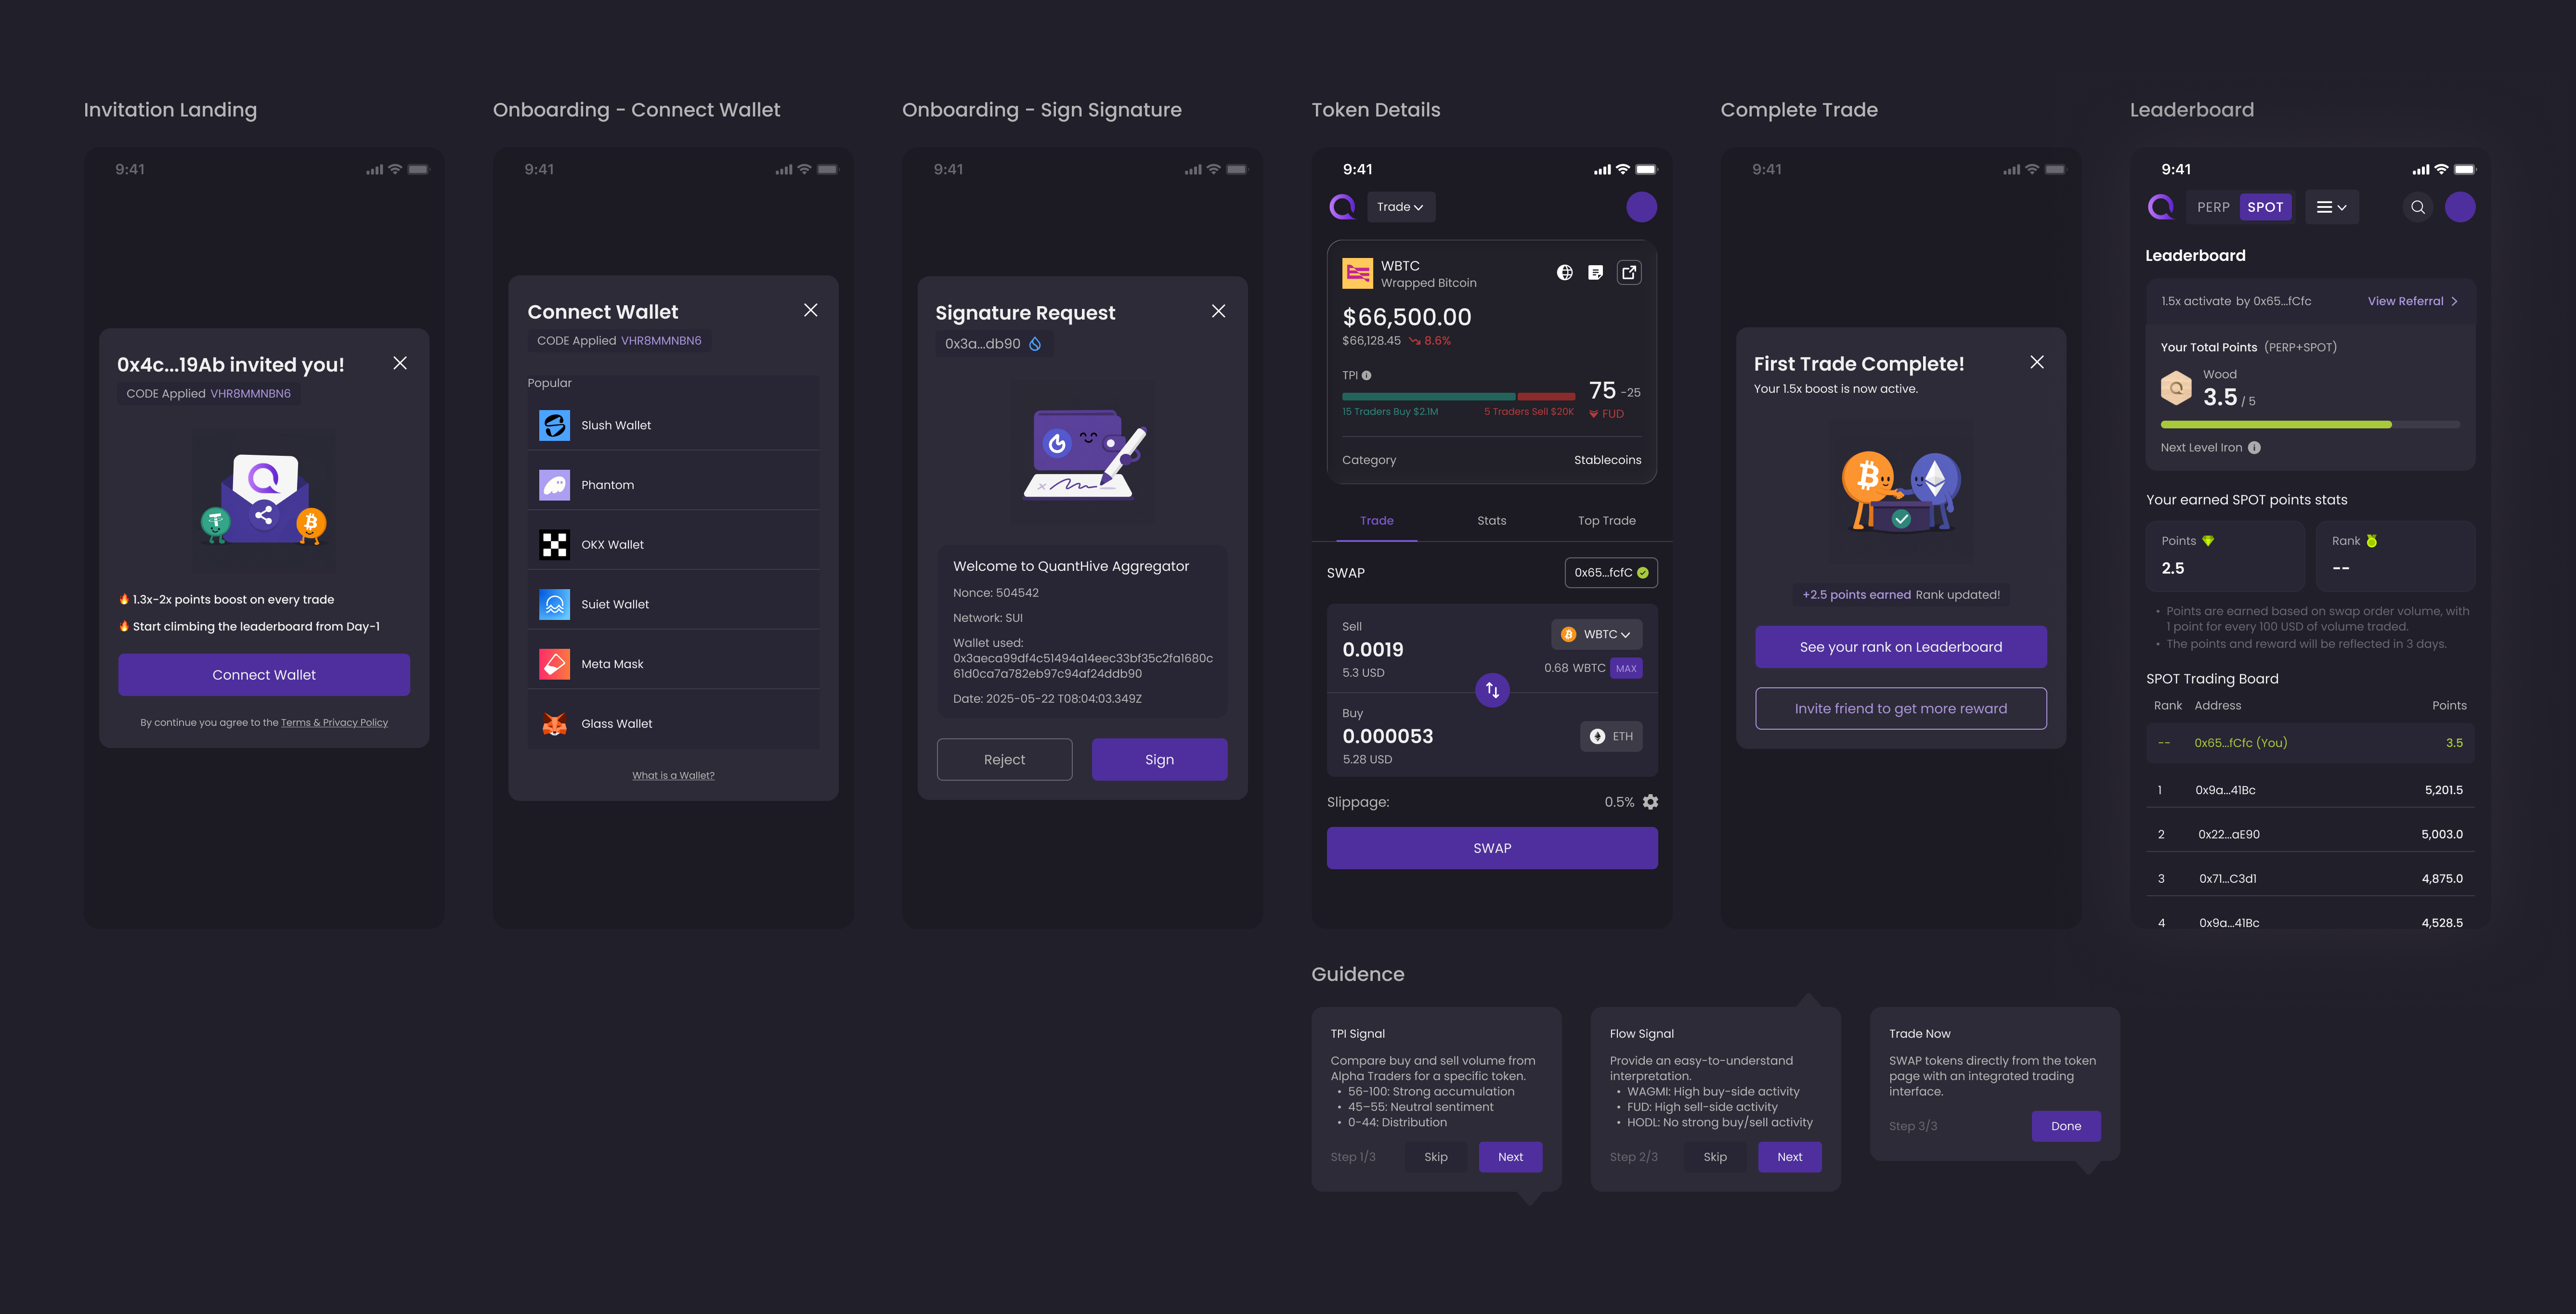
When users landed on an invitation deep link, onboarding was intentionally lightweight, requiring only wallet binding. After signing in, they landed directly on the Token Detail page, where guided tooltips introduced what signals are and how to trade. Once the first trade was completed, users immediately saw their earned points and were connected back to the Leaderboard, creating a clear motivation to keep trading and climb the ranks.
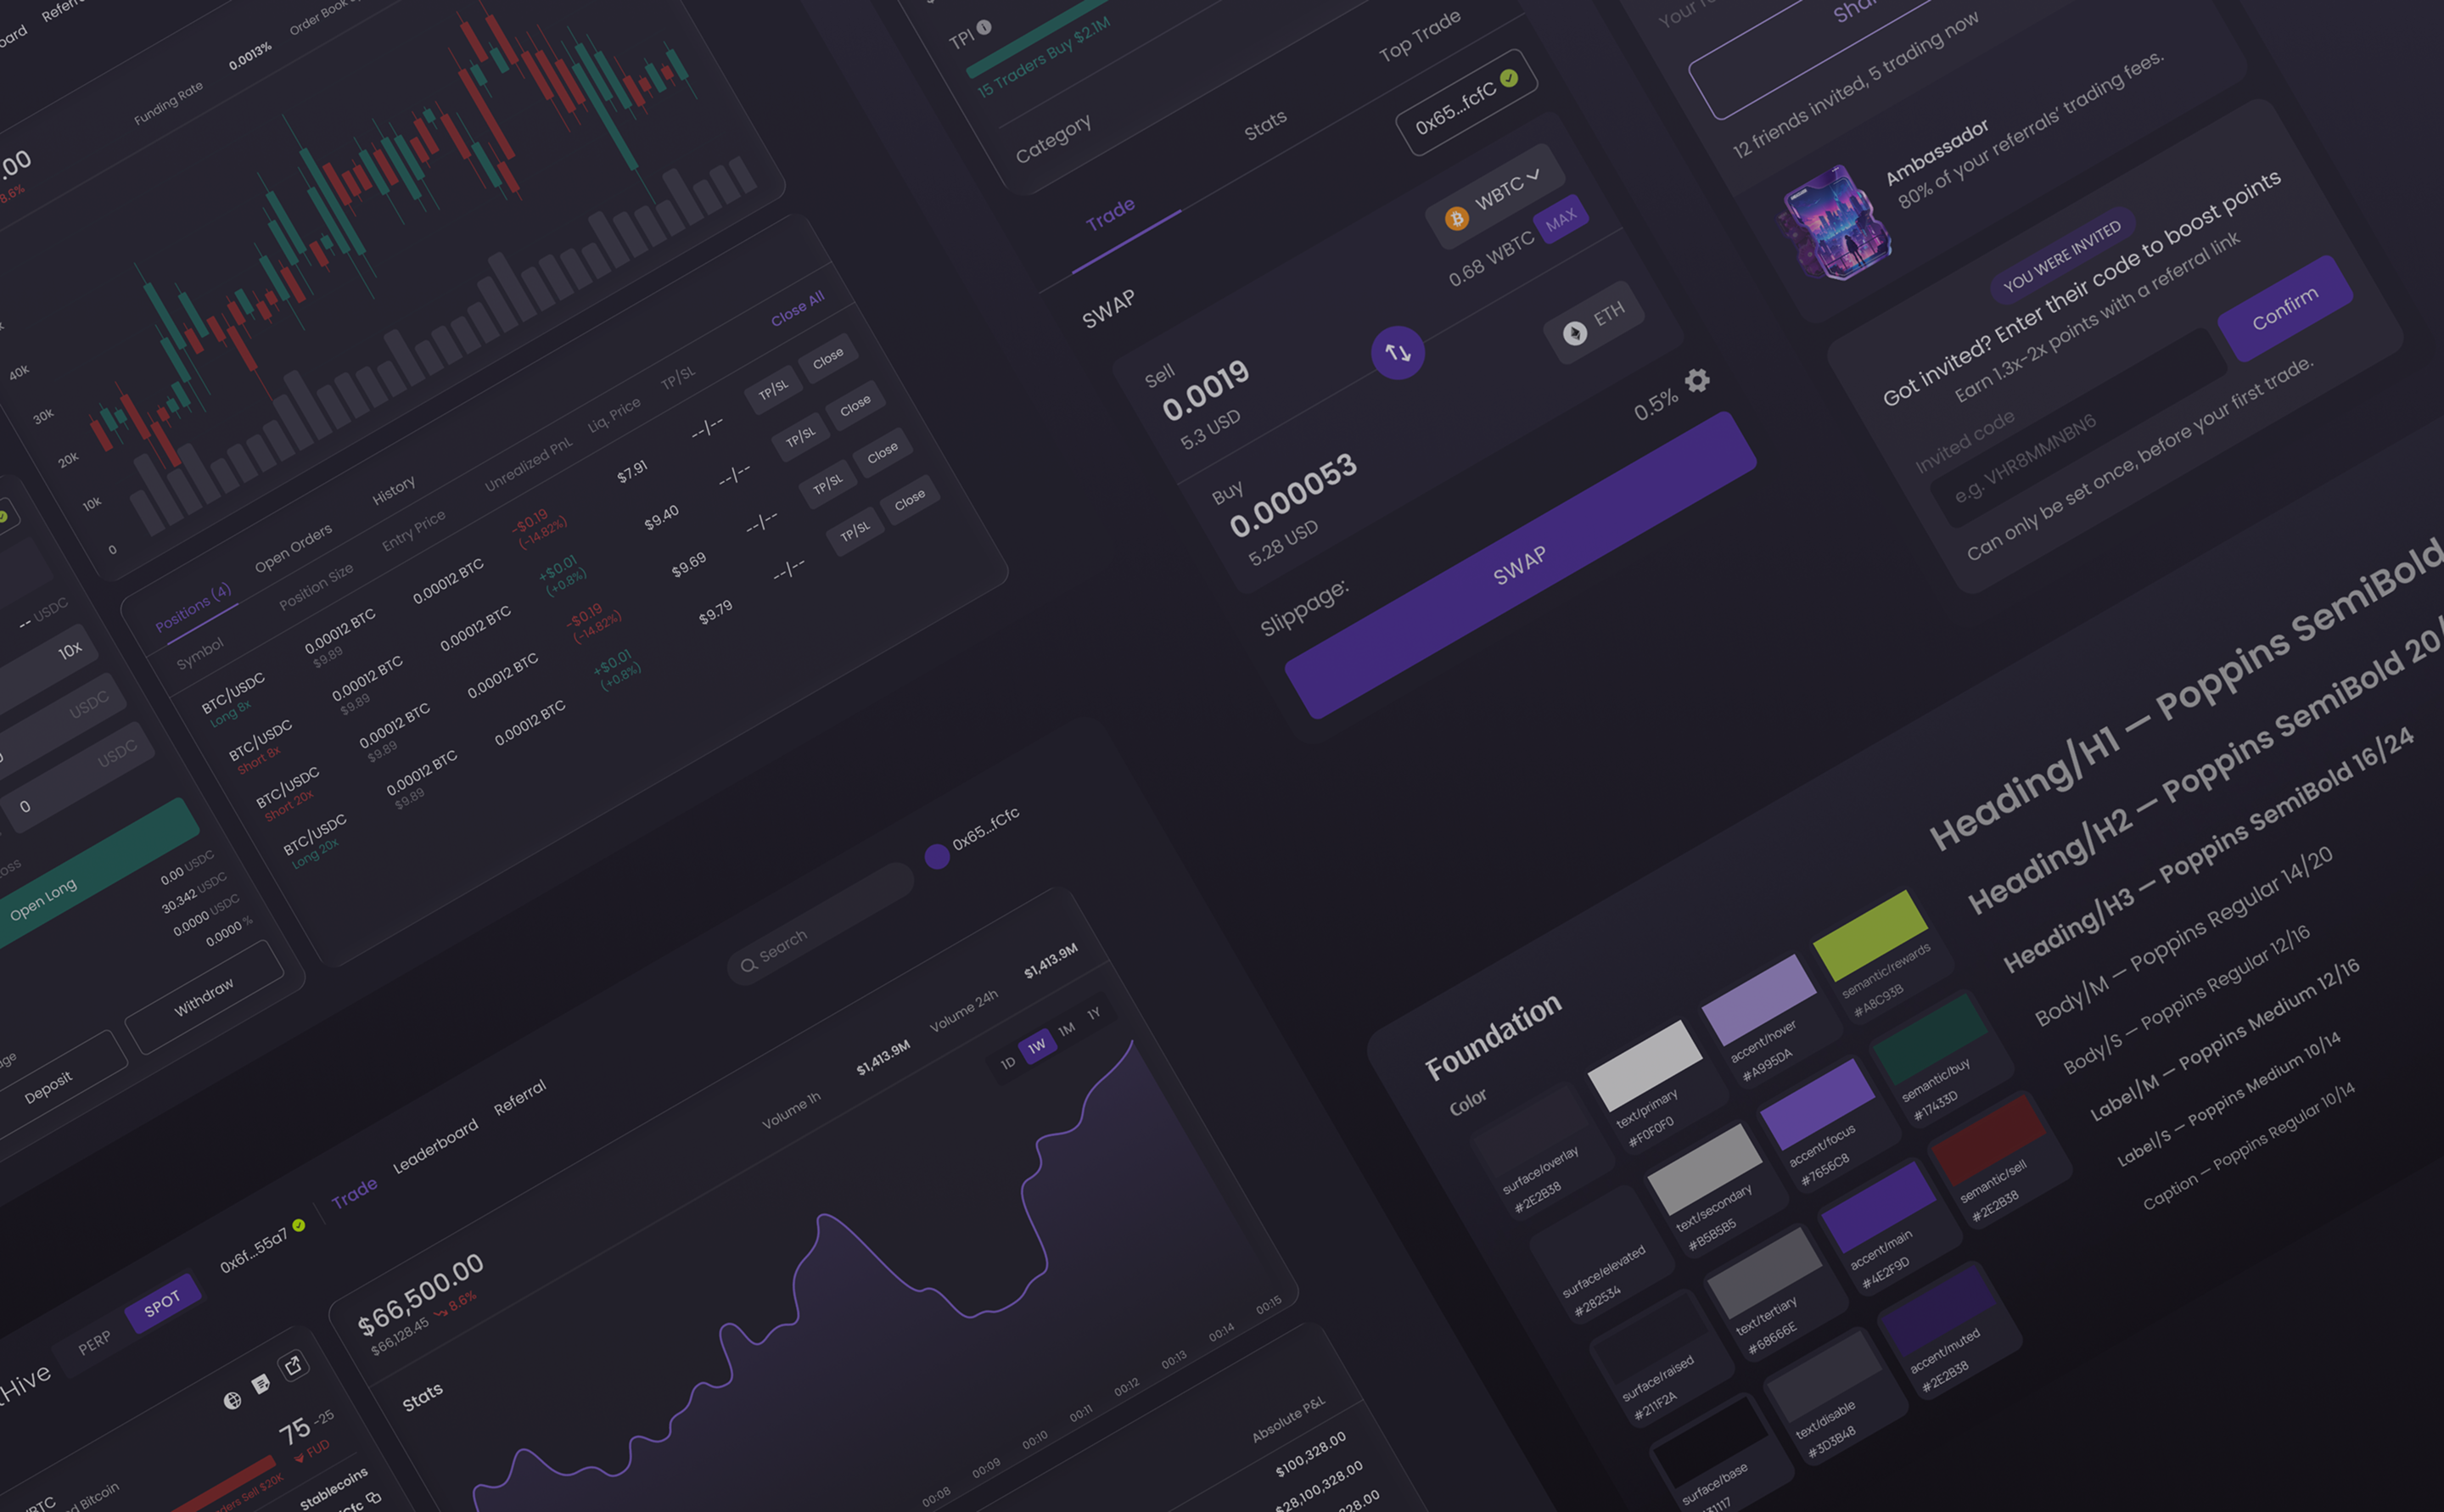
We proactively designed the experience and roadmap to support both SPOT and PERP modes, allowing the product to scale across trading scenarios once regulatory requirements were met.
However, the project was ultimately paused when the company decided to discontinue operations, and subsequent product development and maintenance were stopped.

